Testing 10G network with iperf


I am testing the real bandwidth I can get with a 10G network connection. My server has an intel X540-AT2 network card with 2 10G interfaces.

The server is configured to use bonding in balance-alb mode, but in this test only one interface comes into play because the iperf client only gets a connection from one MAC address.

$ sudo cat /proc/net/bonding/bond0 
Ethernet Channel Bonding Driver: v3.7.1 (April 27, 2011)

Bonding Mode: adaptive load balancing
Primary Slave: None
Currently Active Slave: eth0
MII Status: up
MII Polling Interval (ms): 100
Up Delay (ms): 0
Down Delay (ms): 0

Slave Interface: eth0
MII Status: up
Speed: 10000 Mbps
Duplex: full
Link Failure Count: 0
Permanent HW addr: 00:25:90:f9:3d:54
Slave queue ID: 0

Slave Interface: eth1
MII Status: up
Speed: 10000 Mbps
Duplex: full
Link Failure Count: 0
Permanent HW addr: 00:25:90:f9:3d:55
Slave queue ID: 0


Frist run in the server iperf in server mode:

$ sudo iperf -s
 ------------------------------------------------------------
 Server listening on TCP port 5001
 TCP window size: 85.3 KByte (default)
 ------------------------------------------------------------


An from one client run iperf connecting to the server IP

The first test is using a max transmision unit of 1500 bytes (default)):

$ sudo iperf -c 172.17.16.78 -i1 -t 10 -m
------------------------------------------------------------
Client connecting to 172.17.16.78, TCP port 5001
TCP window size: 92.9 KByte (default)
------------------------------------------------------------
[  3] local 172.17.16.79 port 52458 connected with 172.17.16.78 port 5001
[ ID] Interval       Transfer     Bandwidth
[  3]  0.0- 1.0 sec   535 MBytes  4.49 Gbits/sec
[  3]  1.0- 2.0 sec   594 MBytes  4.98 Gbits/sec
[  3]  2.0- 3.0 sec   554 MBytes  4.64 Gbits/sec
[  3]  3.0- 4.0 sec   553 MBytes  4.64 Gbits/sec
[  3]  4.0- 5.0 sec   565 MBytes  4.74 Gbits/sec
[  3]  5.0- 6.0 sec   605 MBytes  5.07 Gbits/sec
[  3]  6.0- 7.0 sec   597 MBytes  5.01 Gbits/sec
[  3]  7.0- 8.0 sec   587 MBytes  4.92 Gbits/sec
[  3]  8.0- 9.0 sec   602 MBytes  5.05 Gbits/sec
[  3]  0.0-10.0 sec  5.67 GBytes  4.87 Gbits/sec
[  3] MSS size 1448 bytes (MTU 1500 bytes, ethernet)

With this test I can barely get around 5Gbits/sec. It seems too poor for a 10G network card.

In the next test I’ve changed the MTU to 9000 (jumbo frames) in all network devices (server, client and switch):


$ sudo iperf -c 172.17.16.78 -i1 -t 10 -m
------------------------------------------------------------
Client connecting to 172.17.16.78, TCP port 5001
TCP window size: 92.9 KByte (default)
------------------------------------------------------------
[ 3] local 172.17.16.79 port 52101 connected with 172.17.16.78 port 5001
[ ID] Interval Transfer Bandwidth
[ 3] 0.0- 1.0 sec 971 MBytes 8.14 Gbits/sec
[ 3] 1.0- 2.0 sec 1.09 GBytes 9.37 Gbits/sec
[ 3] 2.0- 3.0 sec 1.05 GBytes 9.04 Gbits/sec
[ 3] 3.0- 4.0 sec 1.06 GBytes 9.14 Gbits/sec
[ 3] 4.0- 5.0 sec 1.10 GBytes 9.43 Gbits/sec
[ 3] 5.0- 6.0 sec 1.11 GBytes 9.51 Gbits/sec
[ 3] 6.0- 7.0 sec 1009 MBytes 8.46 Gbits/sec
[ 3] 7.0- 8.0 sec 1.04 GBytes 8.94 Gbits/sec
[ 3] 8.0- 9.0 sec 1.11 GBytes 9.56 Gbits/sec
[ 3] 9.0-10.0 sec 1.07 GBytes 9.21 Gbits/sec
[ 3] 0.0-10.0 sec 10.6 GBytes 9.08 Gbits/sec
[ 3] MSS size 8948 bytes (MTU 8988 bytes, unknown interface)


And now, it looks very different, I can saturate the network link.
To change MTU, I’ve changed it in the server and in the client, in all network devices: bond interface and its slaves. Also the switch must support it. You can change the device MTU easly with this command:

$ sudo ip link set dev eth0 mtu 1500
error: Could not open Tokyo database at path (OpenTokyoDatabase: invalid record header)

I run my server out of space and after that I got these messages when running cf-agent:

error: Could not open Tokyo database at path '/var/cfengine/cf_classes.tcdb'. (OpenTokyoDatabase: invalid record header)
error: Could not write key to Tokyo path '/var/cfengine/state/cf_lock.tcdb'. (tchdbput: invalid record header)

To solve this problem first run these commands:

ls /var/cfengine/*.tcdb |xargs -n1 tchmgr optimize
ls /var/cfengine/**/*.tcdb |xargs -n1 tchmgr optimize

If the problem persists remove the tcdb files and restart cfengine:

# rm /var/cfengine/state/cf_lock.tcdb
rm /var/cfengine/state/cf_observations.tcdb
rm /var/cfengine/cf_classes.tcdb
/etc/init.d/cfengine restart

There is an open issue in Cfengine 3 community

testing KVM disk limits

In this post, I am testing the IO limits for disks provided by KVM. Why should you configure the disk limits in your guests? If you have your KVM disks in a shared storage back-end, as I have, and you cannot control the operations inside your VPS, you should establish some limits for each disk. You should monitor your VPS IOPS load if you don’t want to suffer an overhead in your storage caused by one VPS consuming a lot of IOPS. One VPS can saturate the storage degrading too much the performance of the rest of VPS. This can be, because your VPS are administered by very different people/customers or because you don’t want that an operation you perform in one VPS (that needs high IOPS) can cause IOWAIT to other VPS.

I am using ISCSI with 10 SAS drives configured as RAID10 for my back-end storage. In this test I configured in the virtio disk 200 IOPS and 10MBs for max bandwidth.

The first tool I used to test the limits is hdparm inside the VPS. With hdparm I tested the max bandwidth I could get from the storage, because this tool performs a sequential access. Without the limits I got 156MB and with the disk limited I got the expected 10MB.

hdparm with no limits on the disk:

# hdparm -t /dev/vda

/dev/vda:
 Timing buffered disk reads: 472 MB in  3.02 seconds = 156.36 MB/sec

hdparm with the disk limited to 10MBs:

# hdparm -t /dev/vda

/dev/vda:
Timing buffered disk reads: 32 MB in 3.02 seconds = 10.61 MB/sec

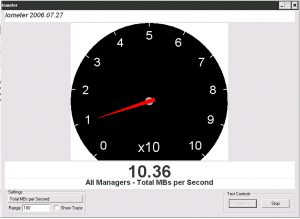
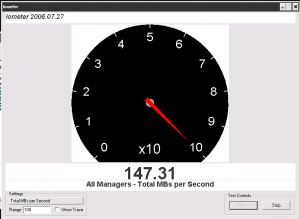
We can verify that the limits are perfectly applied. I used another tool, iometer, to verify the limits, because iometer has many configuration options to test them. To test the max bandwidth I configured a iometer test with a 256KB transfer request and 100% secuencial read access. With this iometer test I got a very similar value to hdparm with no limits on the disk:

iometer_nolimit

And with the disk limited to 10MBs I got again the same value:

iometer_limited

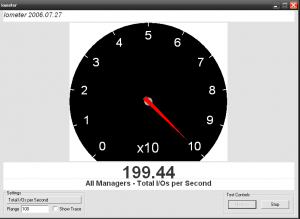
Ok, we know that the max bandwidth limits are applied perfectly well. I wanted to test too the KVM disk limited by IOPS instead of bandwidth. I configured the disk limited to 200IOPS and to test this limit I made a new iometer test, but this time with a 512B transfer rate and 100% sequential read access.

With the disk no limited and disk cache set to none I got about 1800 IOPS:

iops_nolimit

With the disk limited to 200 IOPS I got exactly 200IOPS avg:

iopslimit_limited

The IO limits are applied perfectly well for the VPS and another very important point: These limits are applied regardless of the disk cache mode used. If you use writeback cache mode, you can get many more IOPS in the guest than if you use cache mode set to none, but if you set IO limits on the disk you will get exactly the same IOPS in the guest. Ok, I use cache mode set to none for almost all VPS, so what limits should I configure to prevent abusive use of the storage?

Well, this is very dependant on the workload, but for me, the most painful IO operations I suffered, are from those that demand very sequential access, like creating a large tar.gz, making backups or the process of booting the VPS.

I want to limit the guest IOPS, but without affecting to much the performance of the guest. To archive this I configure 10MB for max bandwidth (reading and writing), 200IOPS for reading and 180IOPS for writing. After some time using these limits, I guess the VPS are hiting the bandwidth limit time to time. For example the VPS boot process lasts a bit longer, but after booting the VPS have an acceptable performance and the entire storage performance are better managed.

Proxmox KVM usb passthrough

Open KVM monitor for your KVM machine in Proxmox GUI or in the command line with the following command:

# qm monitor 168
Entering Qemu Monitor for VM 168 - type 'help' for help
qm> 

Show the usb devices info from your host machine:

qm> info usbhost
  Bus 4, Addr 2, Port 1, Speed 12 Mb/s
    Class 00: USB device 046b:ff10, Virtual Keyboard and Mouse
  Bus 6, Addr 2, Port 2, Speed 1.5 Mb/s
    Class 00: USB device 0624:0294, Dell 03R874
  Bus 2, Addr 3, Port 1, Speed 480 Mb/s
    Class 00: USB device 0930:6533, DataTraveler 2.0
  Auto filters:
    Bus *, Addr *, Port *, ID 0930:6533

According to device “USB device 0930:6533” in the example, add the device to guest machine:

qm> device_add usb-host,id=myusb,vendorid=0x0930,productid=0x6533

Verify that the new usb device is added in your guest:

qm> info usb
  Device 0.1, Port 1, Speed 12 Mb/s, Product QEMU USB Tablet
  Device 0.3, Port 2, Speed 12 Mb/s, Product QEMU USB Hub
  Device 0.4, Port 2.1, Speed 480 Mb/s, Product DataTraveler 2.0

After using it, remove usb device from your guest:

qm> device_del myusb

If you run the command again, you will see the usb device is gone from your guest:

qm> info usb
  Device 0.1, Port 1, Speed 12 Mb/s, Product QEMU USB Tablet
  Device 0.3, Port 2, Speed 12 Mb/s, Product QEMU USB Hub

This has been tested in Proxmox 3.0/957f0862

Apache log: (22)Invalid argument: couldn’t grab the accept mutex

Some days ago I saw these messages in the apache error log in a cpanel server, the virtualhost was getting a 500 error:

[Tue Oct 22 14:37:11 2013] [emerg] (22)Invalid argument: couldn't grab the accept mutex
[Tue Oct 22 14:37:11 2013] [emerg] (22)Invalid argument: couldn't grab the accept mutex
[Tue Oct 22 14:37:11 2013] [emerg] (22)Invalid argument: couldn't grab the accept mutex

To solve this issue, edit /usr/local/apache/conf/includes/pre_virtualhost_global.conf file and add the following line:

AcceptMutex posixsem

Then restart apache

/etc/init.d/httpd graceful

According to Apache documentation, the AcceptMutex directives sets the method that Apache uses to serialize multiple children accepting requests on network sockets.

To read more see AcceptMutex Directive documentation


Notice: Undefined variable: wp_sh_class_name in /var/www/elkano.org/blog/wp-content/plugins/wp-syntaxhighlighter/wp-syntaxhighlighter.php on line 1002

Notice: Undefined variable: wp_sh_class_name in /var/www/elkano.org/blog/wp-content/plugins/wp-syntaxhighlighter/wp-syntaxhighlighter.php on line 1002

Warning: Use of undefined constant XML - assumed 'XML' (this will throw an Error in a future version of PHP) in /var/www/elkano.org/blog/wp-content/plugins/wp-syntaxhighlighter/wp-syntaxhighlighter.php on line 1048